Got a minor graphical confusion I noticed today. The thing is, this train... is no longer decelerating for the sharp corner at the top of that hill, yet the throttle display sits on "some brake" for an entire day after the speed stops descending at 40, meaning the locomotive is clearly generating power against the hill:
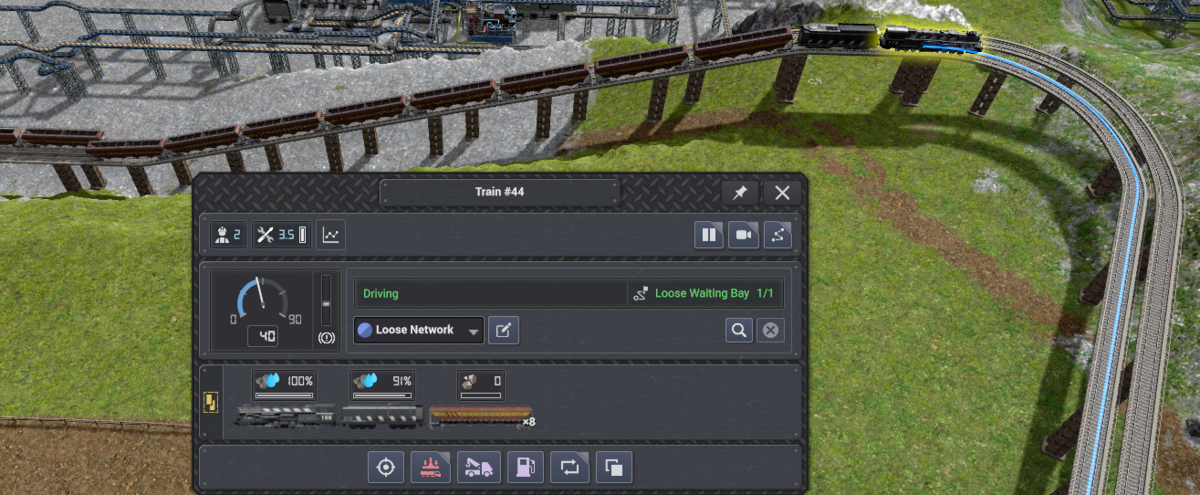
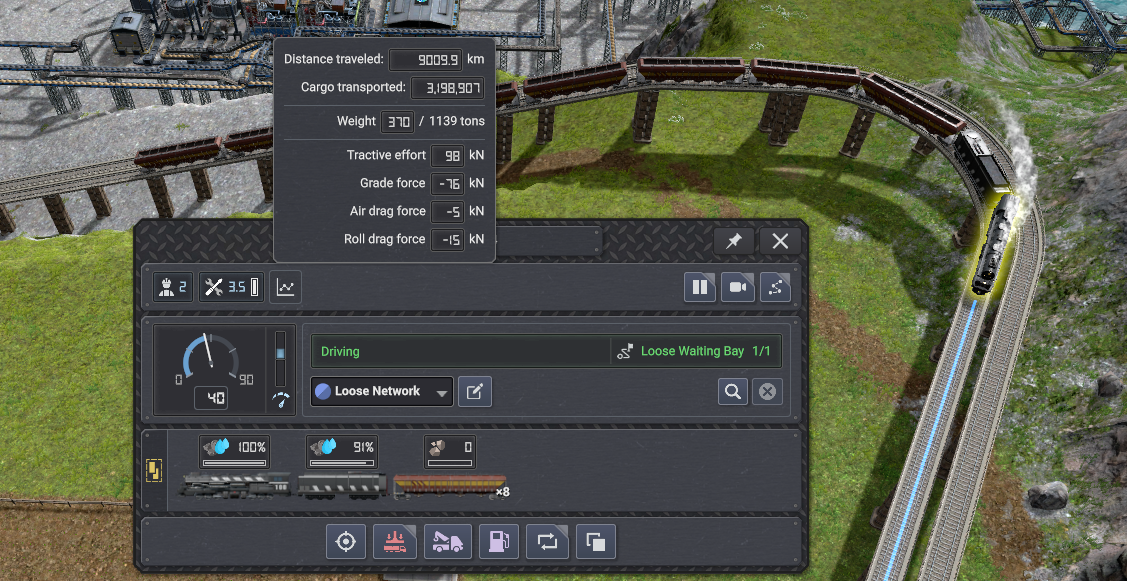
Loaded trains don't stop at 40, since they don't have the power to maintain 40 on that hill, but they also indicate braking for an extra second or two (at 1x play speed) after they've already stopped braking. I will also note the "tractive effort" and other parameters, if I mouseover the statistics icon, also suggest it's still braking. Those figures & displays don't settle to start matching likely actual values (positive tractive effort, decreasing as the train clears the hill) until it gets here:
Which is quite a ways.
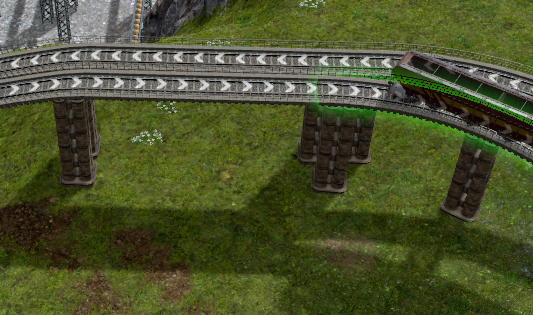
While the apparently-averaged displays could absolutely be doing that in an effort to avoid generating sporadic, unreadable outputs on an oscillating value, I get the idea that a clearly-inaccurate display lasting this far into the curve wasn't quite intended. You probably don't need the hill for reproduction, just the sharp corner at the end of a high-speed zone.
In case you're wondering, the "Grade Force" line does correctly drop to zero the moment the train clears the grade, rather than 4 car lengths later like the tractive effort figure required to stabilize on actual climb power after the brake. Worth note, the tractive effort field required an extra car length- about a day- after clearing the hill to stabilize on the level-terrain 40km throttle value. Still better than 4 car lengths. Then 3 days later, it slammed to max throttle because the train had cleared the corner as well. In case you're wondering, the curve starts at that one pillar.
Update 4.1 | v0.8.4a (b588)
... I guess I'm trying to outdo your own testing team.